We are proud to announce ServiceRocket’s official partnership with Lucidchart!
Lucidchart helps companies clearly communicate ideas, information, and processes. Whether you are trying to visualize your brainstorming session with a mind map or draw flowcharts to standardize company processes. Lucidchart is a one-size-fits-all solution for your diagramming needs in Confluence.
We’re especially excited about this partnership because Lucidchart Diagrams OnPrem easily integrates with ServiceRocket Reporting for Confluence.
If you have used Reporting for Confluence by ServiceRocket before, then you are familiar with the power that Reporting can bring to your Confluence instance by building custom reports from different sources.
With the Lucidchart integration, you can include visual representations of processes or projects along with other relevant information in your reports. Simply use Reporting to find drawings on Confluence based on the criteria you want and catalog them for versioning, run-books, etc.
Start to work visually. Try Lucidchart for Confluence for free. |
|

How to include diagrams in your reports
Here is how to create a custom report and get a list of all Lucidchart Diagrams on your Confluence Space:
1. First, create a report container using a macro such as the Report Table or Report Block macros.
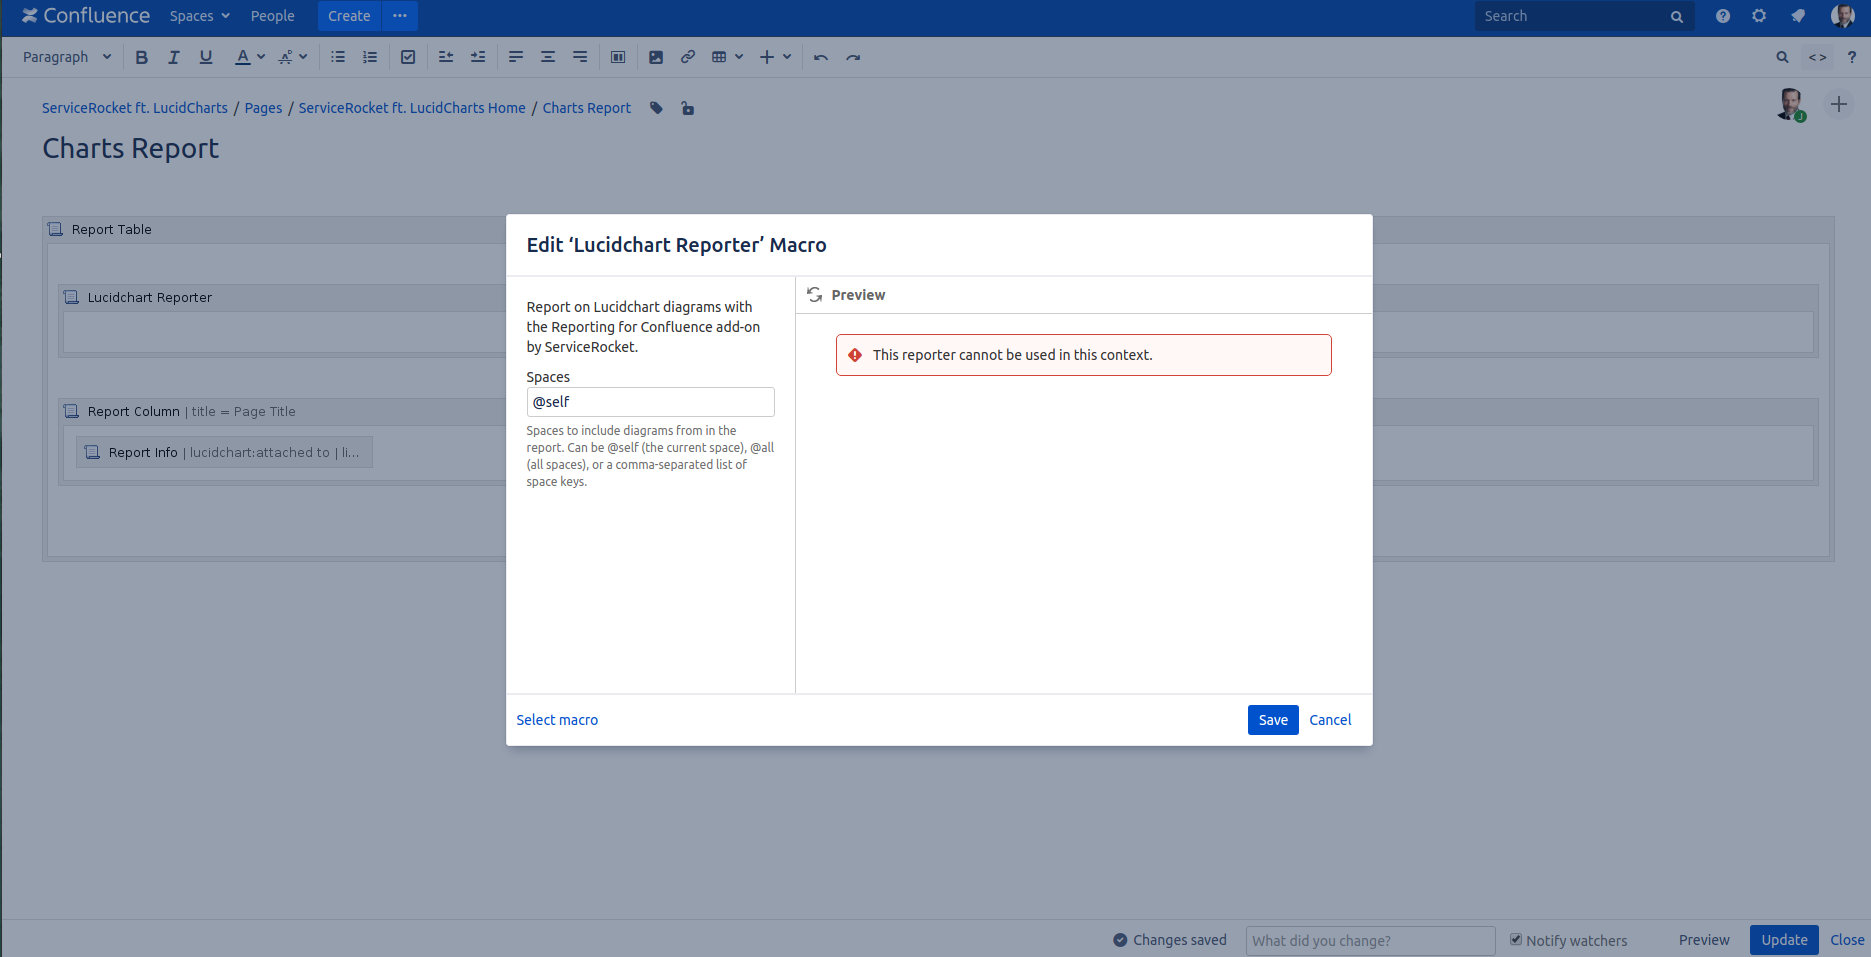
2. Then, place the Lucidchart Reporter macro inside the report container macro of your choice.
Optionally provide space key(s) in the Lucidchart Reporter macro parameters to only display diagrams from the listed space(s) in the report. By default, it will display diagrams from the current space.
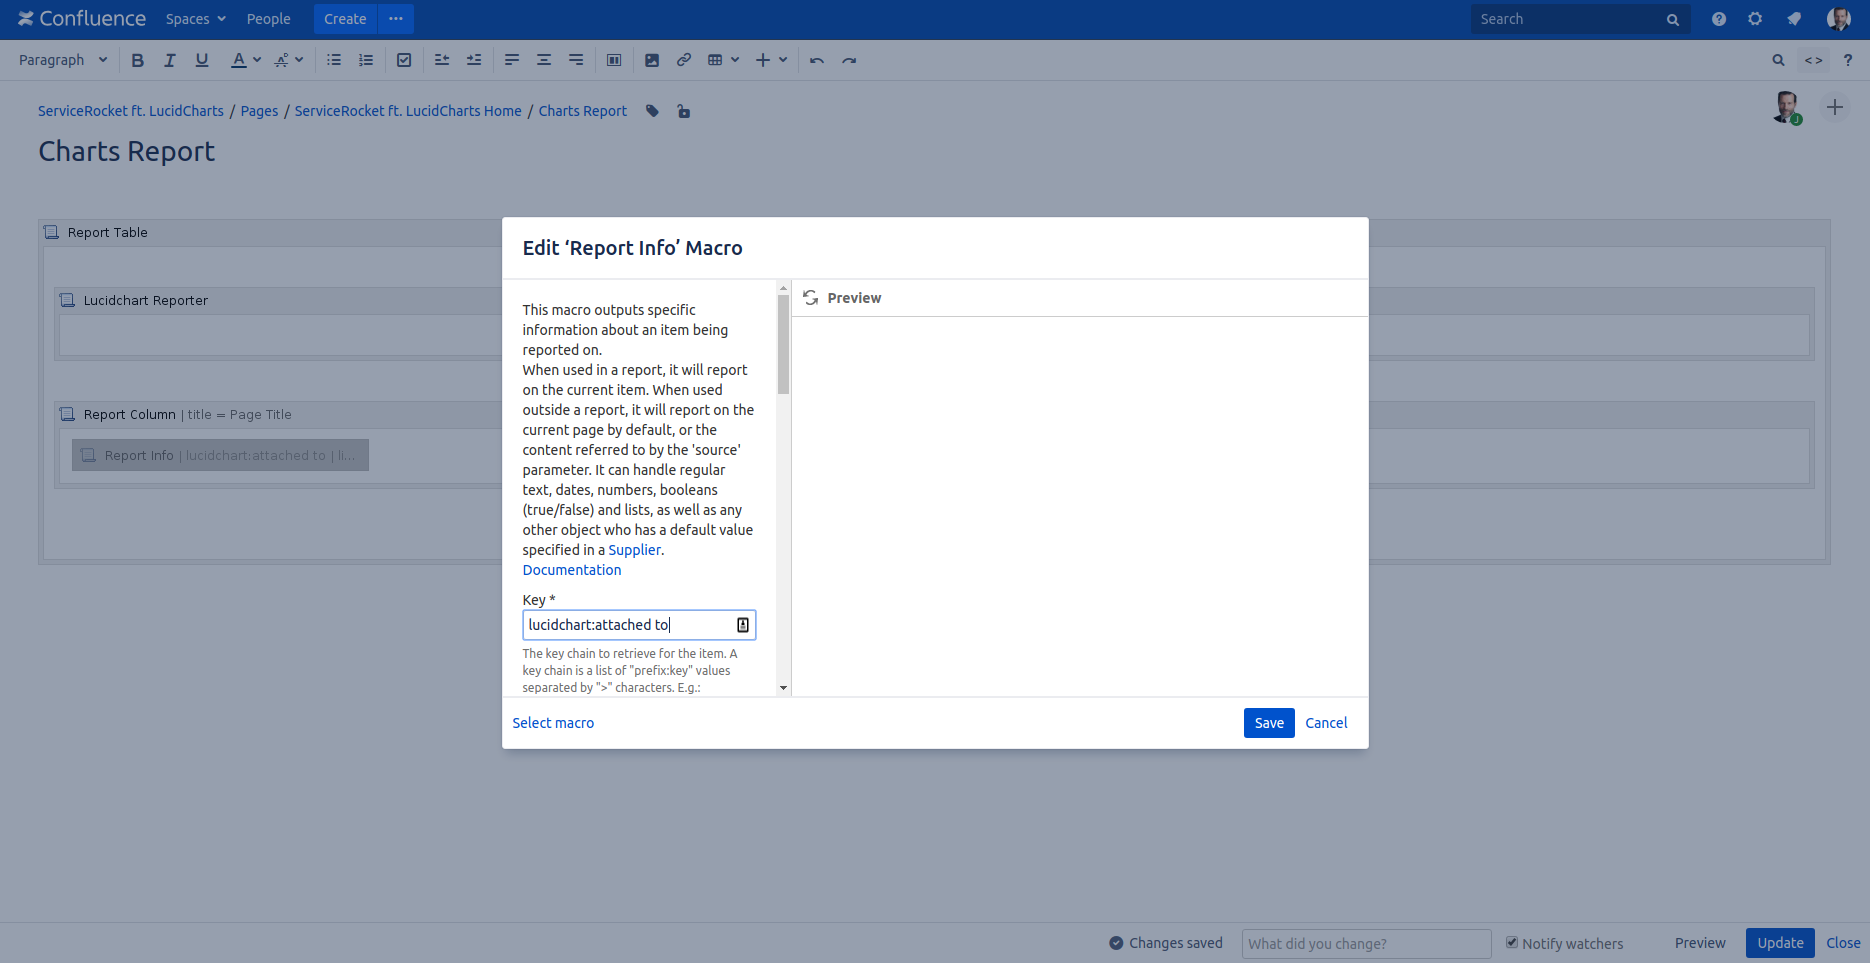
3. Finally, below the Lucidchart Reporter macro, add Report Info macros for the information you want to display.
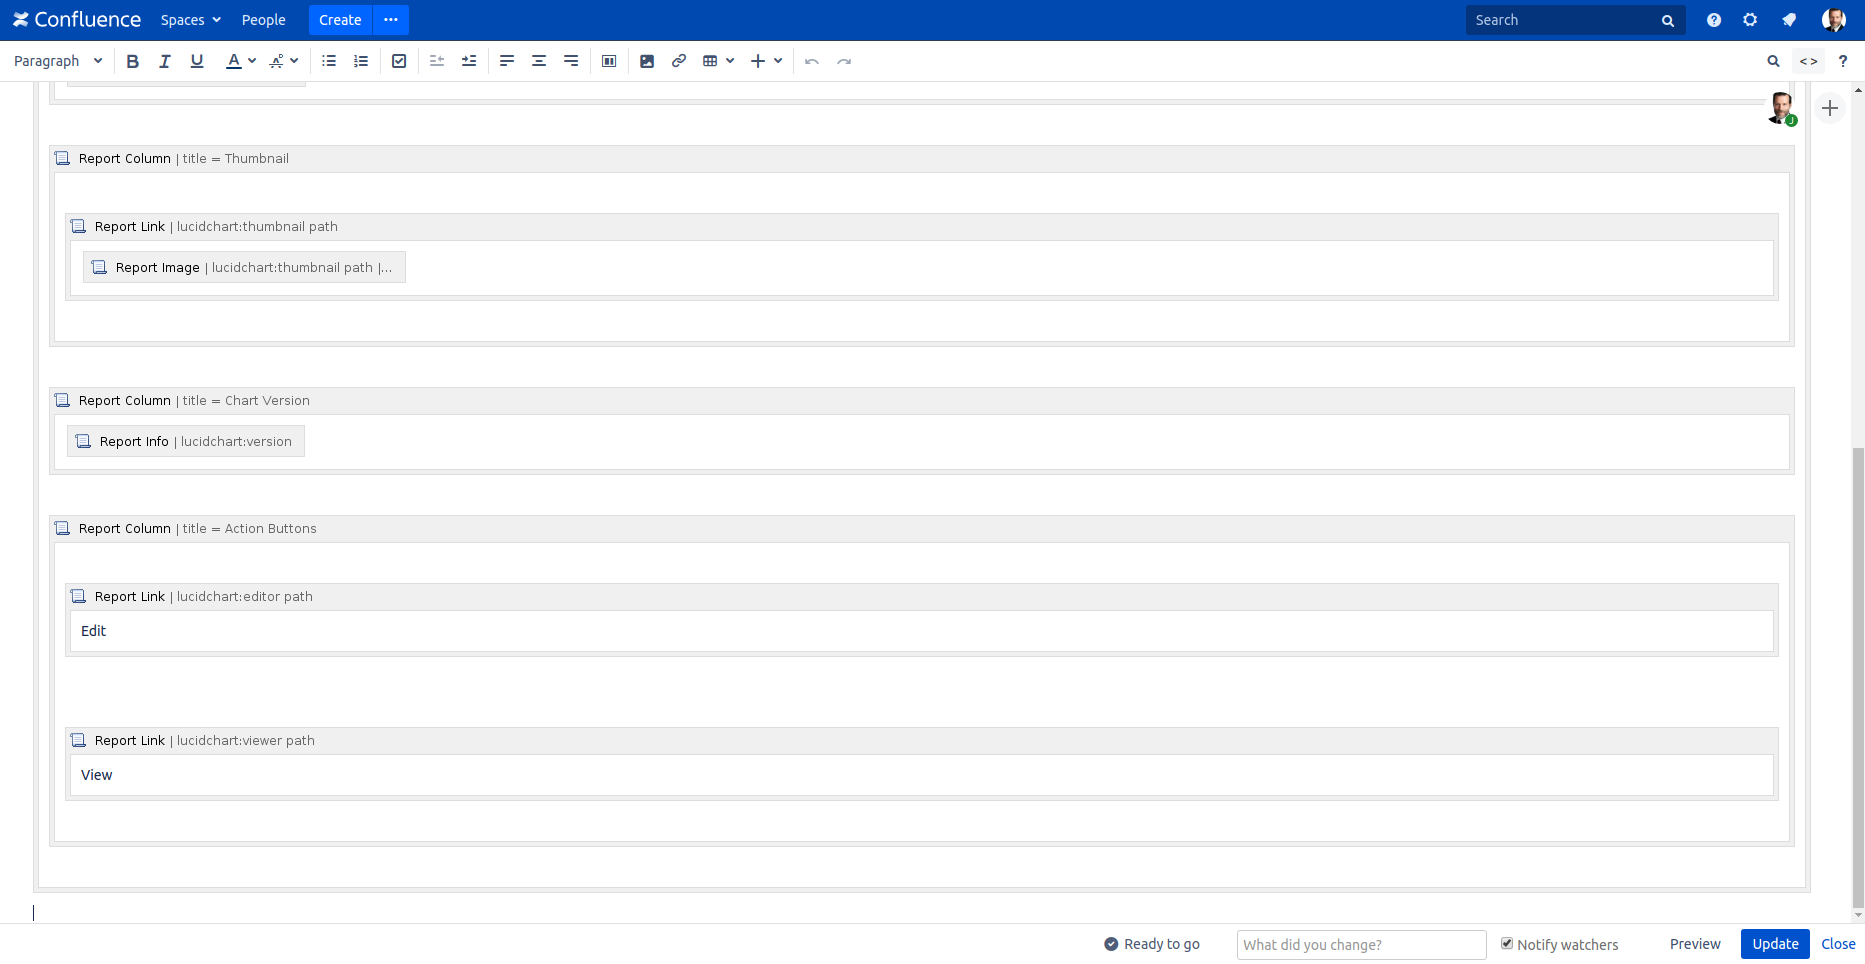
If you are using a Report Table macro as your report container, you will want to place the Report Info macros inside Report Column macros, similar to what you see in this recipe.
You can get the full list of special Lucidchart fields that can be displayed here.
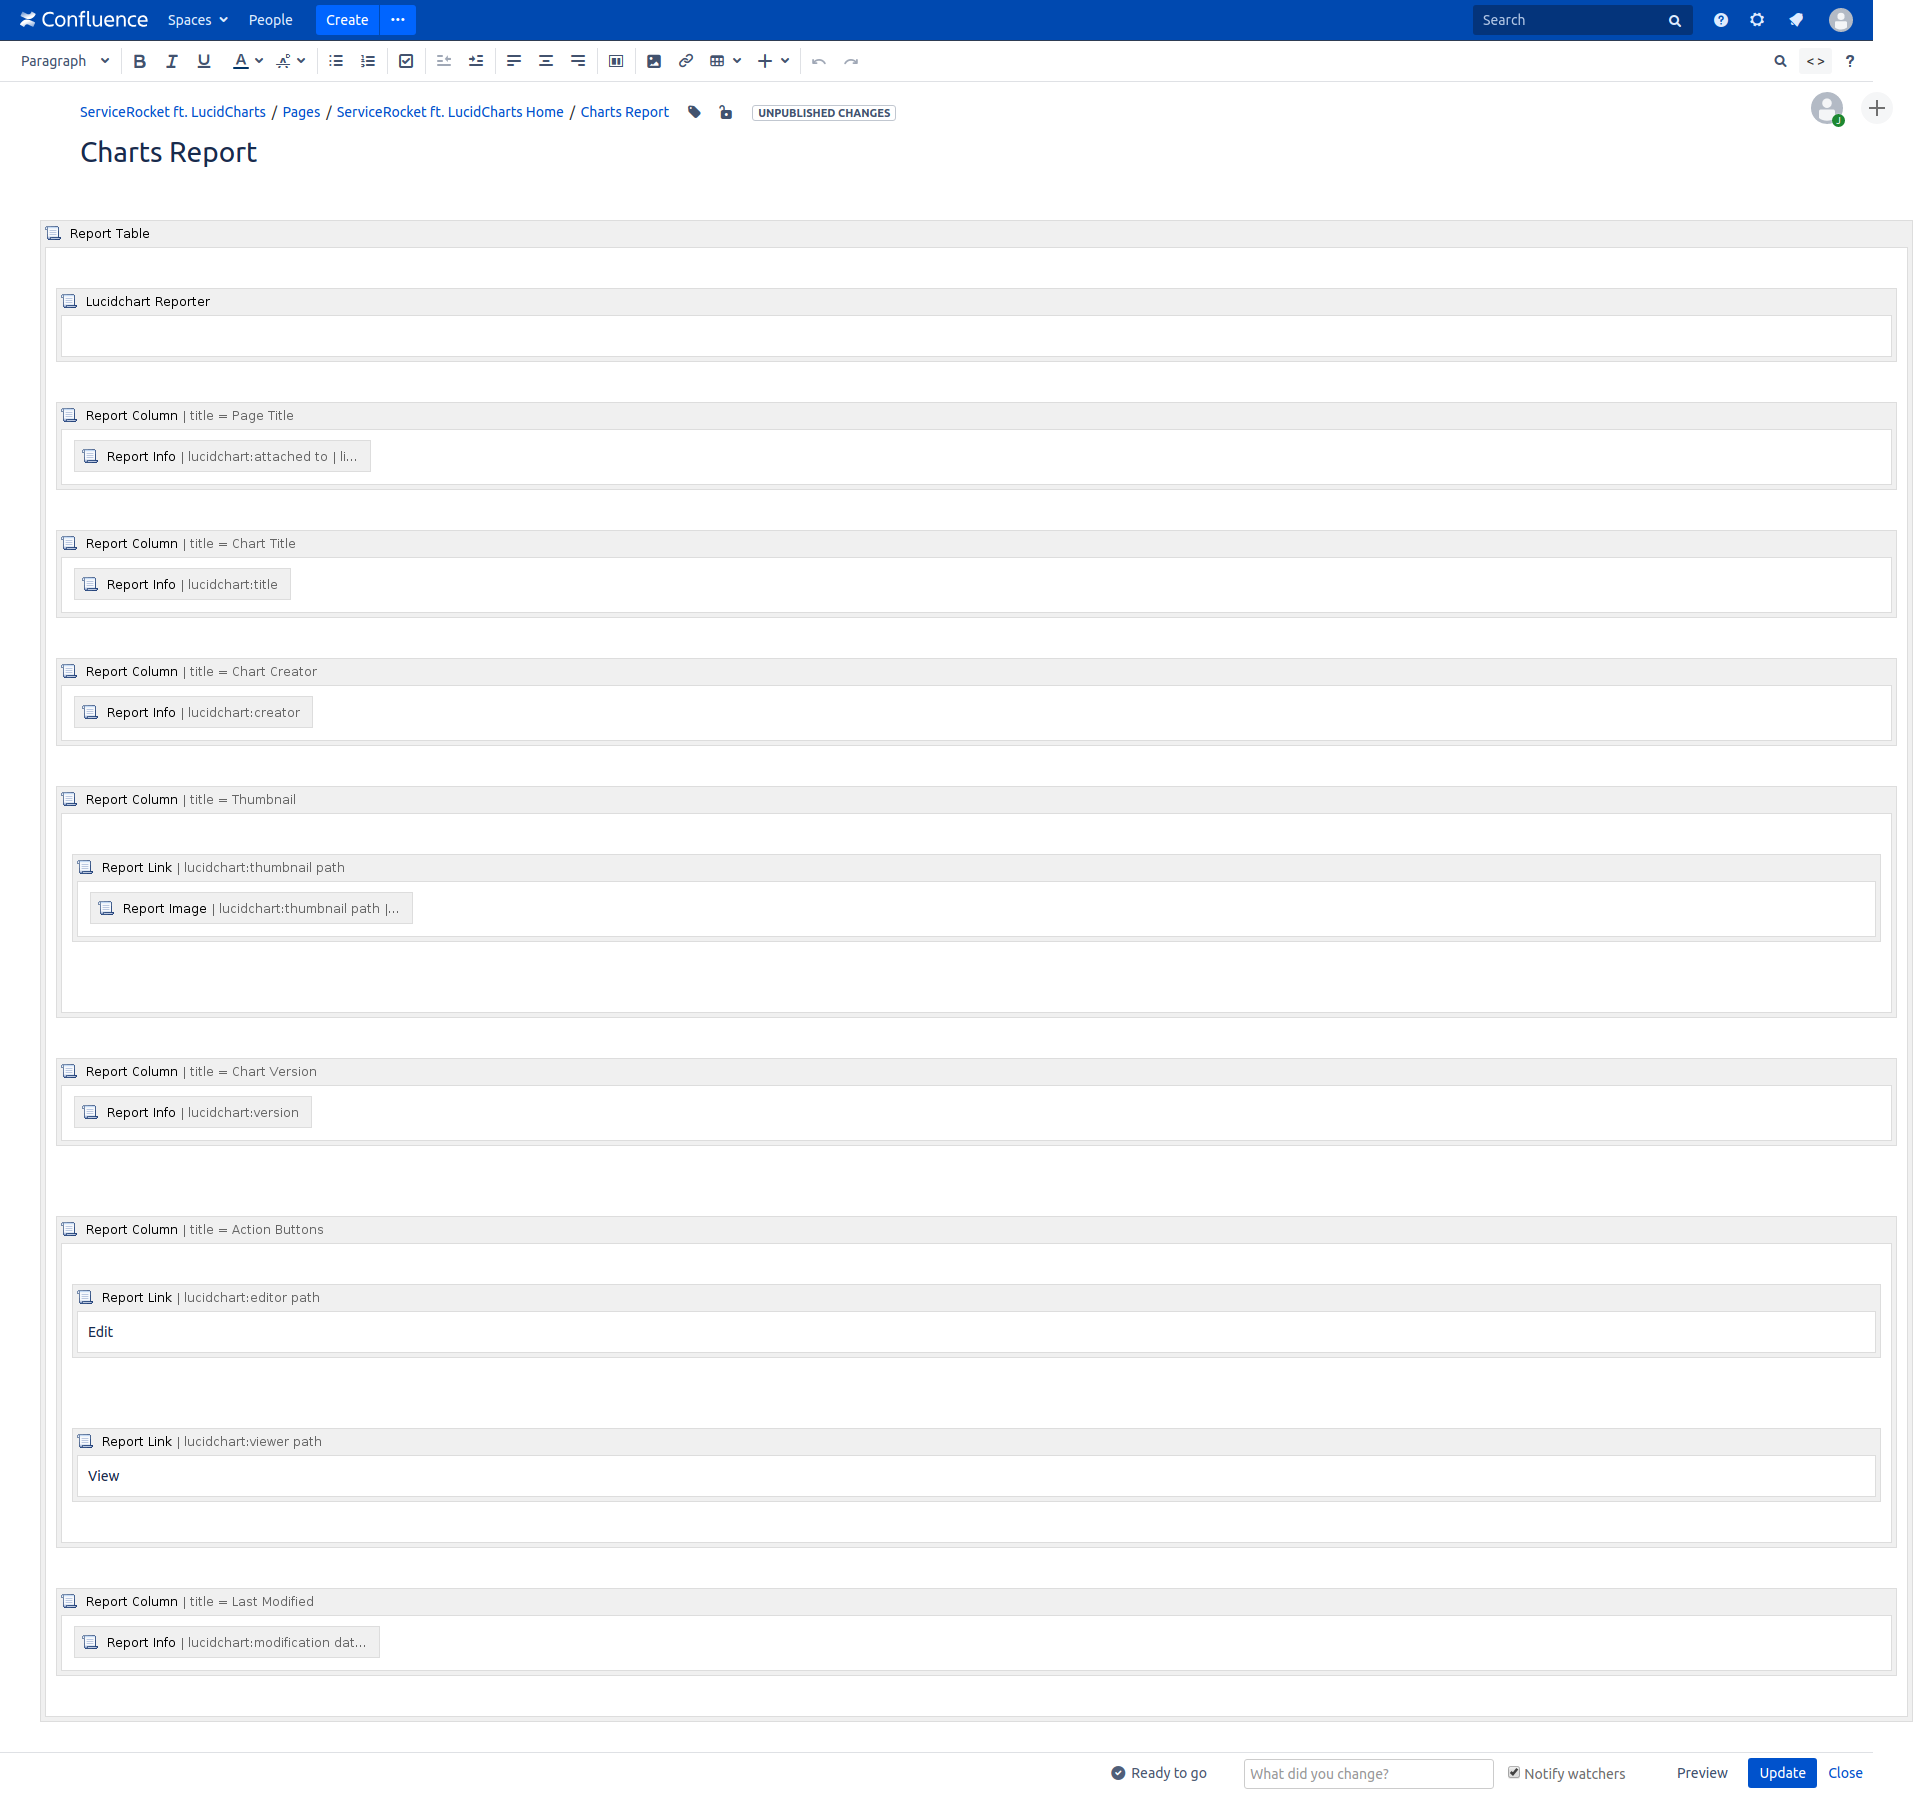
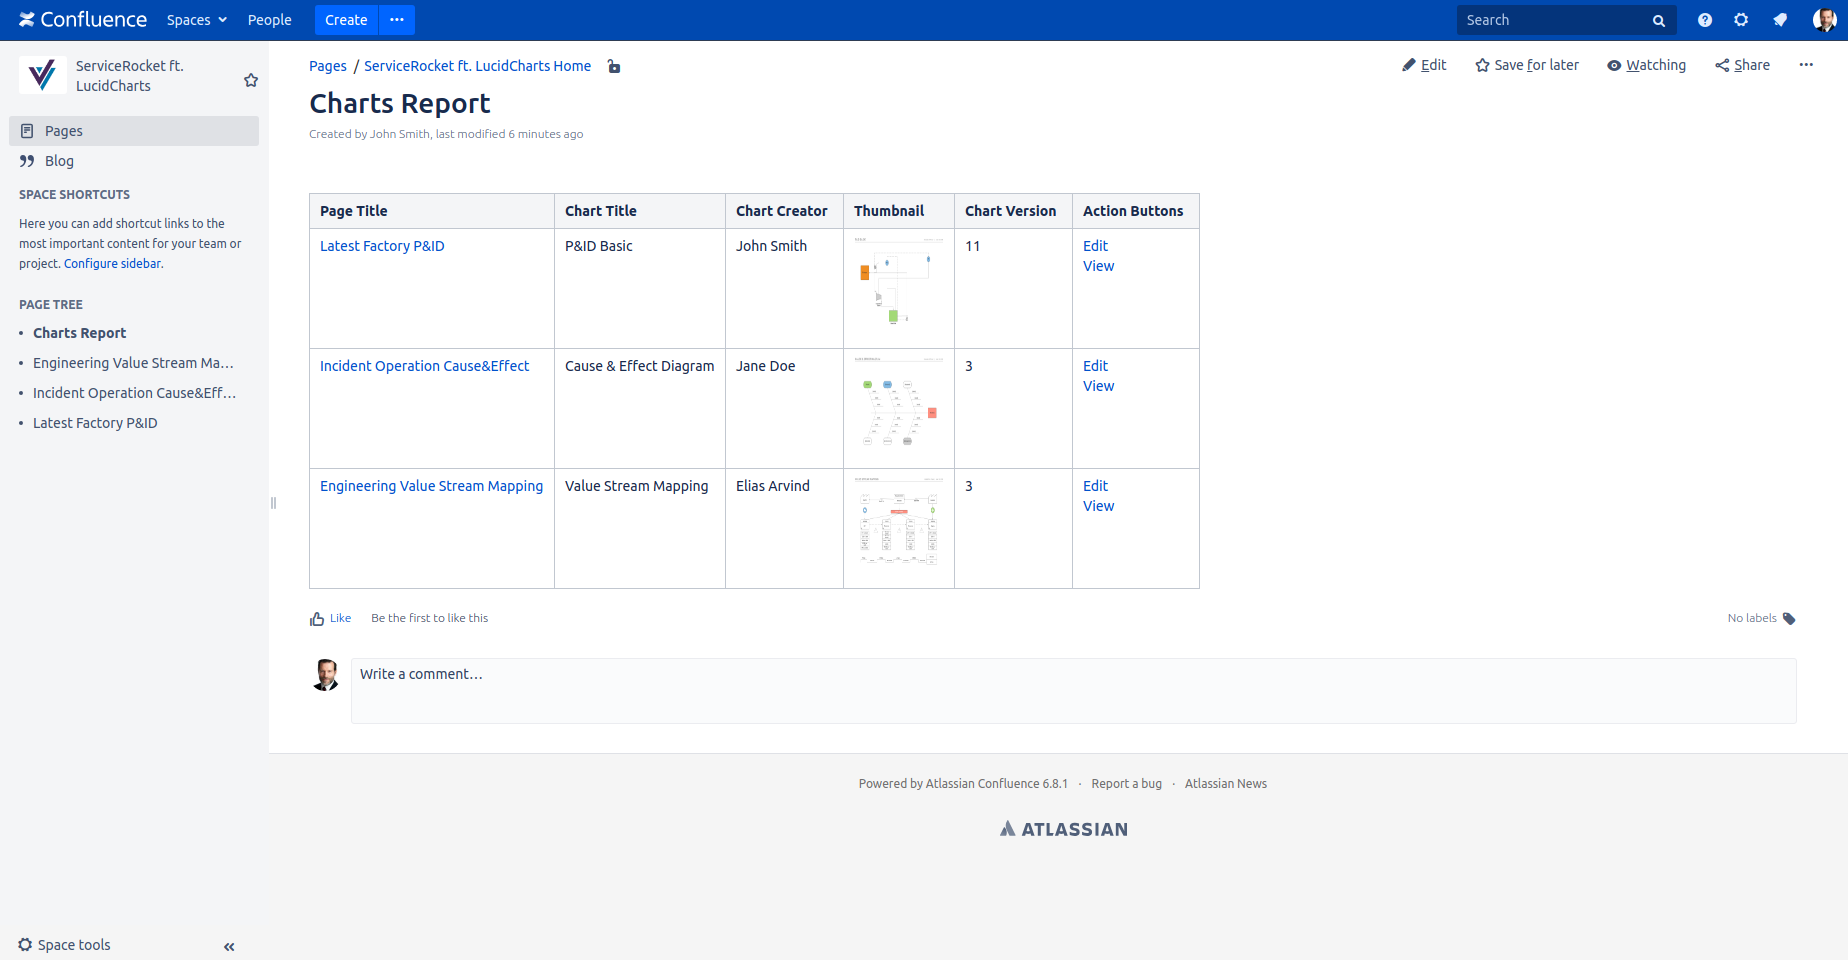
4. That's it! Here's how your report would look like:
Start to work visually. Try Lucidchart for Confluence for free. |
|